Saturday, March 31, 2012

Before and After - Backtesting Your Intuition

Hello inter-friends!

So one of the things I have been having a little bit of trouble with in my daily trading is having the confidence to actually pull the trigger and execute my plan. When I first started daytrading seriously, I overtraded a lot the very first week and I lost a pretty large chunk of change. It was enough to make me sit back and ask myself whether this daytrading stuff was really for me. After that happened I took almost an entire week off to just watch the markets and watch the trades that others were executing, the idea being to give myself some perspective and to affirm that I did in fact know what I was doing, I just needed to settle down and focus. Since that time I have been much more cautious about the setups I play and whether they are strong setups or not, but lately I've actually been a little too cautious. Specifically, I've fallen into a problem called paralysis by analysis, which basically means that I over-analyze all of my setups and constantly wait for more and more confirmation that they are working correctly and by the time I am confident enough to enter, it's too late. This is a dangerous problem to have because what ends up happening is that by the time you've finally confirmed your setup is working, if you enter the trade there's a good chance that your risk is much, much higher now and that the trade will turn around on you.

Now, I make it a habit to send an email once a week to the person who is in charge of the team of traders I work with. In the email I'll include a list of charts that I'm watching for the week and I'll ask for his input on the charts. Does he think the setups are strong, am I missing anything that could make my risk higher, are they high-probability setups, has he played these stocks in the past and had notable results? These are the questions I'm asking and the feedback I'm looking for. I almost always get a response back saying the charts look great, but lately what I've found is that even though I have confirmation from someone who's been doing this for 10-15 years, I still find myself hesitating a bit too long and missing a lot of opportunities. To combat this, I decided to be systematic about it and analyze all of the charts I've sent for the last two weeks for a before and after status. That's what this post is about.

Each of these charts are stocks that I have been watching for the past couple weeks. The vertical line on the "after" chart for each stock indicates the day that I made the call, so I can see how accurate the call was by following what the stock did the day after the vertical line. I am hoping that by going back and reviewing these charts, I will find either a) that a high percentage of my calls were correct and that I should just be more confident and trust my gut, or b) that many of the setups are failing and I should reevaluate what I look for when I seek out stocks to trade. To make it persuasive, I will also include the amount of money I missed out on making by not taking some of these setups, based on a $5,000 position which is usually about the size that I play. At the end, I'll total it all up and hopefully smack myself in the face with the realization that if I had just been a little more confident, I could have made a lot more than I have over the past couple weeks. I haven't even done this myself yet, other than to take the screenshots of the charts, so I don't know at this point what the results will be, but let's find out:


The following are charts I started watching the week of 3/23/12. The comments on the "before" charts are questions I was asking the person I sent the charts to (click to enlarge):

ACOR before:

ACOR after:
Conclusion: This stock hasn't really done anything. I am still watching for a break of the $27.50-$27.75 area. $0 opportunity missed.

AMRN before:
AMRN after:
Conclusion: This was a short call, meaning I thought the stock would go down. The next day it did. Assuming a drop from $11.92 to $11.60 this would have been a 2.7% gain. $137.93 opportunity missed.

BRP before:
 BRP after:
Conclusion: This trade never developed. It gapped down the following day so the potential break of the flag never happened. $0 opportunity missed.

CKEC before:
 CKEC after:
Conclusion: I should have taken this trade the next day. It was another short call that dropped from $12.52 to $12.20, a 2.6% gain. $131.15 opportunity missed.

CVO before:
 CVO after:
Conclusion: This trade was another which gapped down and never developed. Looking at my question on the "before" chart, however, there's something interesting to learn here: increasing volume on a downtrend is a really bad sign. This actually should have been a short call in which case, had I played it the next day I would have taken a $4.02 to $3.11 gain, 29.2%, or $1463.02. This was an incorrect call but also a huge missed opportunity. 

GMAN before:
 GMAN after:
Conclusion: I absolutely should have traded this. The gap up the day after I called it was actually due to earnings, so it would have been lucky had I bought it the day before at $15.50 where my call was, however, I definitely should have bought at the first opportunity on the following day. I remember watching this and thinking "it can't possibly go any higher" over and over again, just watching opportunities pass me by. Had I taken the trade like I planned, I could have taken $17.15 to $19.69, or a 14.8% gain. $740.52 missed opportunity. Furthermore, this could have easily netted me over $1,000 since I would almost certainly have held part of the position for one or two more days after such a large gain on the first day. It was a huge mistake to not play this trade.

HCKT before:
 HCKT after:
Conclusion: This is another one that I definitely should have played. Following the day I made the call the stock broke out of the formation just like I expected and ran from $4.80 to $5.25, a 9.4% gain. $470.00 missed opportunity.

MATR before:
 MATR after:
Conclusion: This play was a potential short. However, generally speaking when a potential short goes sideways it gives it the potential to run higher. That is exactly what happened in this situation, so while the original call never developed, I should have kept this on my watch list a little more closely since when it broke the flag at $8.15 it ran to $8.75, which would have yielded a 7.36% gain. $368.10 missed opportunity.

MYRG before:
 MYRG after:
Conclusion:  This setup did not develop like I expected it to. However, it should be noted that the stock is now "basing" meaning it has hit the bottom and is going sideways. Usually this means that it is about to make a small correction, in this case the breakout would be above the blue line (the 50 day moving average, which I'll talk about in other posts eventually), and could be a potential run from $18.30 to $19.00, or a 3.83% gain. I am keeping this one on my watch list.

PATH before:
 PATH after:
Conclusion: PATH was supposed to be a swing play, meaning I would buy it and hold it for multiple days rather than what I usually do which is buy and sell the same day. At the time I called this stock I was still waiting for a proper entry (some indication that it was turning around). That never happened, but now we see another opportunity in it, possibly above $3.85 for a run to $5.00. This is a huge gain, 29.87%, for only 15 to 20 cents risk, or $1493.51 on a $5,000 trade. I am keeping this one on my watch list for that opportunity.

PWAV before:
 PWAV after:
Conclusion: I should have taken this trade. It worked just like I'd planned, opening low, taking out the previous day's high at $2.35 and then running to $2.58. This would have been a 9.79% gain. $489.36 missed opportunity.

SCVL before:
 SCVL after:
 Conclusion: This play was similar to GMAN, in that it had a nice setup and then an earnings release the next day. Many times I do this: scan for earnings releases and then filter those releases to charts that have strong setups, that way I have a great setup as well as an emotional catalyst to push the price of the stock. I realize now that I should have played this, even after the price gapped up as you see on the chart, because like GMAN it was a huge gainer. It did exactly what I expected it to but I thought it couldn't go any higher because it had already gapped so high. Seeing both GMAN and SCVL do this as well as many other trades that have taken place in our chat room over the last couple weeks, I am starting to learn that this is pretty standard. A large gap on an earnings release is common if the release is good, and they can sometimes run 20, 30 or even 50 percent in one day. This would have been a run from $29.19 to $32.24, or 10.45%. $522.44 missed opportunity.

I have several more of these charts including some that I started watching on 3/27/12, but after reviewing these and seeing the results I think I know what my conclusions are, and they are what I suspected: I need to trust my gut. Had I played each of these stocks as I had planned, I would have finished the last two weeks with a profit of $4322.52. Furthermore, since I made some other trades last week that netted me some $200-300 gains, and since I generally cap my losses around $130, even if I made 20 trades during the week all of these trades took place in and 50% of them failed, I still would have netted over $3,000 in profit during that week alone! This also doesn't even count all the trades that the rest of my team makes which occasionally I take as well.

This is why paralysis of analysis is such a dangerous problem to have. Not only does it prevent you from making huge profits if you're good at what you do, but it can end up costing you money when you try to enter setups too late. For next week and going forward, I am going to use this shocking number, over $4,300 in missed profits, to convince myself that I need to follow my instincts and take the trades I have studied hard to understand. As I work through this problem I expect to see some of these profits materialize in my account, which I hope will continue to build my confidence so I can continue to improve. If you are trading and having trouble, or you constantly find yourself looking back and saying "Man, I was so right! If only..." then try backtesting your intuition like I've done here. Chances are that you know what you're doing, and you will get results similar to mine that will help motivate you to trust your gut.

Monday, March 26, 2012

Daytrading Homework 101 - Preparation

Hello ladies and gents!

I wanted to do a post on how to properly prepare for a day of high frequency trading (i.e. daytrading) for anyone out there who is interested in getting involved with it. You know, it's funny: a lot of people hear the word "daytrader" and instantly associate it with lots of money made at the expense of others by a lazy person who just sits in front of their computer all day pushing buttons. In reality it's actually quite the opposite. First of all, there are very few billionaire daytraders, and most successful traders make less than $250,000 per year. While this is certainly a comfortable income, it is a drop in the bucket compared to what serious investment bankers and fund managers are making. But then, most daytraders are daytraders because they love the job, not because they want to be billionaires. Secondly, trading full time can actually be (and usually is) a 50-60 hour per week job, and that's not even counting weekends. Contrary to what most people believe, professional daytraders are not working 9:30-4pm when the market is open and partying the rest of the time. Most are up at 6am reading the news, gathering ideas, determining the general market sentiment and preparing for the market open at 9:30am. After 4pm, most are documenting their trades, analyzing their performance, and beginning preparation for the next day, many times until 6 or 7pm at night.

Trading is a full time profession and the market never sleeps, so if you are serious about doing this for a living you need to be completely immersed in it, and you need to enjoy it. I know several professional traders and almost all of them work 10-12 hour days regularly. After hours they are making watch lists, writing blog posts, reading Twitter feeds from other traders, analyzing the market action for the day, etc. The tradeoff is that if you're good at it and you do your homework, you can write your own paycheck and built a portfolio that will allow you to take off time whenever you want while letting your investments work for you. Many of the professional traders I know are completely dynamic, meaning they have trading platforms set up in their homes, on their phones, and anywhere they frequent. By doing this they allow themselves the freedom to work wherever they happen to be if they want to visit with family and friends, take vacations, etc. That is the beauty of being a professional trader. It really isn't the money - it's the freedom.

Even though I'm still far from the point of going full time as a trader, I have developed a fairly successful system for preparing for the day which I think will stick with me for a long time. I've constructed it based on my experiences with other professional day and swing traders and combined the things that they have told me work best for them with some of my own ideas. The good news is you don't need any money to do this, so if daytrading for a living is something you're interested in you can do all this stuff without even making any trades, just to see how you might do. Anyway, without further ado here is my technique:

First of all, I am constantly reading the news. I scan Yahoo! Finance, Google Finance and Marketwatch as a time killer. When I have nothing to do at night, I will quickly jump to these sites and see if there are any major headlines. This is one of the easiest ways to pick up ideas. Unfortunately if it's a headline, there's a good chance that by the time you get into the trade it will be too late because the price will have been driven up by those who read the news before you, but for the amount of effort it takes this technique is worth it because you might get lucky and find something great.  Yahoo! Finance also has a fantastic resource called InPlay which summarizes headlines from many different sources in a concise and easy to read format. They even go as far as to bold sentences that they believe are important so it's easy to quickly scan through the headlines and find earnings releases, lawsuit settlements, major contracts, new customer announcements, etc. Regardless of the source, when I scan these headlines I am really only looking for one thing: something that affects a company's bottom line. The idea of the money that might flow in from a big contract or a lawsuit settlement; the idea of the money that might be lost because a company's product needed to be recalled; an earnings release that beat estimates (or missed them): these things are extremely powerful emotional catalysts to the price of a stock and can make you serious money when coupled with a technical setup on the chart. I scan InPlay every morning, as well as Story Stocks. Many of my best plays have come from InPlay so I highly recommend it.

In these initial steps I am adding pretty much everything I come across to my watch list (list of stocks to watch). Anything with any shred of hope for a pop or a drop in the price goes on the list, even if it's far-fetched, because I will narrow this list down quickly later on with a really awesome and free tool. Next, I check the blog run by the guy who leads my team of traders, www.bullsonwallstreet.com. Every night the blog is updated with the watch list for the next day, created by the guy who runs the site who is a professional daytrader with over 15 years of experience. Anything that is on his list is added to mine, to be narrowed down later on. Unfortunately this service is not free, but you can also follow some of the traders I trade with on Twitter and snag pieces of this info for free in real time. That brings me to my next point: Twitter.

It might sound ridiculous, but some of the best traders I know constantly follow each other around on Twitter. There are several feeds I follow on Twitter that I'll list here so if you're on it you can follow them too and watch them trade as well as snag their watch lists which are usually posted:

  • @stt2318 - This guy posts his watch lists as well as his portfolio on a weekly basis. You can see every single trade he makes, his profits and losses, his monthly performance, etc.
  • @bullsonwallst - The group I trade with. This feed is mostly blog updates, but every once in a while you'll snag something useful that you can access without being a member.
  • @mb_willoughby: Maribeth Willoughby - one of our team members at Bulls on Wall Street. This girl makes some amazing calls and posts a lot of them as well as her watch lists on Twitter for free.
  • @BioRunUp: This guy is a professional daytrader who specializes in biotech stocks.
  • @tradermarket247: Another professional daytrader who constantly makes amazing calls.
  • @szaman: And another, Szeman is a great trader that I work with every day. I follow him and bman religiously and they find some great picks.
  • @idrinkchai: Our resident tea drinker. This guy is a fantastic technical analyst and posts tons of his picks and his watchlists on Twitter. He is also part of the Bulls crew but no one seems to know his real name...we all just call him Chai.
  • @danielmardorf: Formerly known as @johnwelshtrades, this guy is a self-made millionaire thanks to daytrading. He posts full disclosure with his trades as well as his portfolio value on a regular basis. I should mention he's effing hilarious too. Watching his feed is very entertaining because he loves to call people out when they go against his recommendations and lose money because of it.
  • @kunal00: Kunal Desai - the guy who founded Bulls on Wall Street. He is a pro daytrader with over 15 years of experience and has taught me almost everything I know about technical analysis. He only posts his watch list on Twitter occasionally (since he usually posts it on the website for his paying members) but he does post updates of trades he's making all day long.
Once I have browsed through Twitter and the news, I'll usually have about 50 stocks to sort through. These stocks come from both reading the headlines and from the watchlists of other traders who have posted them on Twitter. At this point I resort to an amazing tool called Finviz that helps me break them down. I will go to Finviz and enter all the tickers at once in the top right corner, then set the view on charts. This makes it easy to quickly scan through the charts of the 50 or so stocks I have and narrow down the list based on patterns I like. Currently I only play a couple of different types of patterns because I am still fairly new to the daytrading game, so I will visually scan looking for those specific patterns and eliminate anything else. I will cover pattern analysis in another post, but once I scan through all the charts I can usually eliminate about 80% of them because I either don't like the pattern or the pattern is not quite ready to break yet. I also love to use some of the pre-made screens on Finviz, specifically the unusual volume screen since it almost always has tons of stocks that have recently gone crazy and might continue to go crazy, and stocks that are about to go crazy. There are many other useful screens built into Finviz including scans for stocks that have been upgraded/downgraded, are releasing earnings, are overbought or oversold, and countless others. You can even scan for specific chart patterns and then narrow them down based on whatever criteria you prefer.

I'm sure at this point you're starting to see a pattern. Essentially all I am doing is browsing through hundreds and hundreds of charts, reading the news, checking live feeds from other traders, and picking out anything that works for my particular style of trading. There are a number of other tools I use: Zack's screener, Stockcharts.com's predefined scans, Yahoo!'s Earnings Calendar, Stoxline, and TickerSpy are all great resources for ideas. I also have a list of about 200 stocks that are constantly played by the Bulls crew, so I bookmarked Finviz with all those stocks entered in so all I have to do is go to that bookmark and scroll through the charts looking for anything that might be interesting. Ultimately, I usually only use these other resources for gathering possibilities, then I break them down with Finviz by visually scrolling through all the charts. It sounds like a lot of work but it's not that bad. I can usually complete this whole process in just a couple hours since I know the patterns. Once you know the patterns to look for, you can do the same!

Finally, once I've got my list narrowed down to about 20-30 stocks that have patterns I like and are priced in my range, I will go through the list and analyze the charts in detail on a site like www.freestockcharts.com. This is a great site because it allows you to annotate the charts and view them on multiple time frames all the way down to one minute, as well as add notes and set alerts. I will use this site or my trading platform itself (DAS Trader Pro) to really zoom in on the charts I like and figure out which ones might be ready to go the next day and which ones probably won't be ready for a few more days. As I go through all these stocks, I will annotate the charts by drawing support and resistance lines, trend lines, etc and make notes right down to the very last detail about where I will enter the trade, where my stop loss should be, what my first and 2nd targets are, and any potential pitfalls. I also eliminate some stocks, because sometimes once I zoom in I will find that the pattern isn't as nice or that the risk is too high. What I end up with are two lists of stocks: one list of stocks that might go within the next few days, and another list that could go immediately. The list of stocks that could go immediately (usually by now narrowed down to only 6 or 7) becomes my watch list for the day. The rest of them become the first stocks I look at for the rest of the week, and as they get ready, I will add them to my daily watch list and play them, then remove them and add new ones. I create this weekly list each Sunday, and add/remove things to/from the daily watch list from it and from InPlay and my daily sources all week long.

Now that I've done my homework, I can simply wake up in the morning, scan the news for any major changes, get an idea of what the general market sentiment is, and execute on my plan. Since I've planned everything beforehand, it makes life easy during the day. All I need to do is trade.

Preparation is vital to your success as a trader. If you're a longer term investor, you don't need to prepare daily, but you should be doing an equal amount of analysis on the fundamentals of the company before you invest, so the principal is the same. As a trader, you need to do your homework because the market doesn't wait for slackers. Even as prepared as I am most of the time, there are still times when I miss trades that could have been hugely profitable because I simply wasn't fast enough to get in when the risk was still tolerable. Unfortunately this happens, but the fast pace of the job is part of the excitement too! In the end, I really think the people who are successful in this game are the people who love to do it and so the "homework" comes naturally to them. It's up to you to decide whether or not you're one of those people.

I hope this post helps you to understand a little bit more about what it takes to properly prepare for a day of trading. Please leave comments and questions below!

Monday, March 19, 2012

Managing Your Emotions by Managing Your Risk

Hi everyone!

I hope you're all doing well in your investing adventures. This post about managing risk is aimed more at traders than investors, but even if you're not a trader I believe that understanding the concepts illustrated here can help you make better investment decisions, so I recommend reading it anyway.

If there is one thing that is guaranteed to prevent a person from being a successful trader, it's too much emotion. As I transitioned from long- and mid-term investing to short term trading I struggled with this myself. I actually still struggle with it a little bit, so this post will also serve as a reminder to myself of some of the ways we as traders can use systematic risk management to manage our emotions and be more successful.

The first thing to understand if you are to really grasp this concept is which emotions are most likely to tear down your success. While there are of course many emotions, there are two that stand above all when it comes to preventing you from being successful in this business: FEAR and GREED.

On one end of the spectrum we have our ingrained fear of losing money which often prevents us from being invested period. The rationalization is that if you never invest, you absolutely will not make money in the market, but you also absolutely will not lose money in the market. This rationalization makes sense on the surface, but if you look a little deeper you will see that there is a glaring flaw: Cash depreciates in value and prices rise over time. Even though you might think you are protecting your cash flow by keeping your money in cash and not investing it, you are actually guaranteeing that you will lose money over the long term as prices inflate and the value of your cash (no matter what currency) depreciates.

On the other end of the spectrum we have greed, which really is just another type of fear: the fear of not making as much as you could have on a given trade or investment. Greed can be just as dangerous as fear, since it can prevent you from taking profits when you should and can lead to your once-profitable investment becoming unprofitable since, generally speaking, prices fall faster than they rise.

In order to be successful in the investment world you need to overcome emotion and trade systematically. Allow me to repeat that: In order to be successful in the investment world you need to overcome emotion and trade systematically. Trading systematically will allow you to always have a worst case scenario in mind. This eliminates the fear of the unknown and can assist you in justifying your decisions whether you're working with $1,000 or $1,000,000,000. Of course there are many ways to overcome fear and greed when investing or trading, but there are a few that, in my opinion, will help you to rapidly develop the core personality traits of a successful risk manager and thus, hopefully a successful investor or trader.

Give yourself a comfortable risk tolerance:
    • First and foremost, you need to know what your risk tolerance is. I'm not talking about the "how attached to my money am I/how big are my balls?" type of risk tolerance. There is no way you can quantify that so it's really pretty useless. What you need are hard numbers. Here's an example: Regardless of your portfolio size, you need to accept that on every losing trade you will lose some percentage of that value. If your portfolio value is $10,000, pick a number that you might be comfortable with, say 1.5%. This tells you in cold, hard numbers that on any losing trade you could lose up to $150. Are you ok with that? If not, reduce your percentage until you are. 
    • Of course if you're trading mid or long-term (investing), you will need to allow yourself a bit more leeway (with a $1,000 beginning portfolio invested in two stocks maybe you are willing to lose up to 12% of your investment before you cut your losses, for example), since the stock will swing much more given a larger timeframe. An added benefit this provides for you is to give you a "bust allowance" or a number of allowable bad trades before your portfolio is totally busted. As an example, with a $10,000 portfolio and a 1.5% risk tolerance, your bust allowance is 66.67 meaning you could potentially make around 66 terrible, losing trades before your portfolio was completely diminished (not considering commissions of course). This helps when you make a really terrible trade and lose a ton of money very quickly, since you know in the grand scheme of your investing that you could still do the same thing 65 more times before you were totally busted.
    • Whatever your tolerance, the point is that you need to quantify it. Make an Excel spreadsheet detailing your portfolio value, risk tolerance, and bust allowance. Experiment with different values and see how you feel when you actually look at the dollar amount. It's easy to assume that 1.5% is not a lot of money, but when you're throwing $15,000-$20,000 at a trade 1.5% suddenly becomes more than many people make in a full eight-hour workday. It's especially important for high frequency and daytraders to use this strategy since you will be trading multiple times in a day and prices can both skyrocket and plummet in a matter of seconds (no, I'm not exaggerating).
Create a trade journal:
    • A trade journal allows you to track your progress throughout your investing and trading adventures. When you buy or sell a stock, document everything.  Write down the price you bought, where you set your stop loss (see stop losses below), the reason you decided to buy at that price, the price you sold, how much money you made, the reason you sold when you did, any potential pitfalls, what your risk was as well as your potential reward (see reward to risk ratios below) and anything you could have done better or any thoughts you had about the trade (things you were worried about, etc). Doing this for every trade will allow you to see in black and white what you need to improve upon and what you're good at, as well as what works and what doesn't. It is especially important that you document your failed trades/investments and the reasons that they failed. Understanding why you lost money is the key to making money the next time!
Use stop losses:
    • A stop loss is a special kind of order that must become your best friend! When you enter a stop loss order (commonly known as a "stop") your stock will automatically be sold if the price reaches a certain level. Stops are extremely important for daytraders and high-frequency traders because prices can change so rapidly during the day that it is literally possible to lose thousands of dollars in the amount of time it takes you to go to the bathroom. By setting a stop loss, you eliminate this risk and gain peace of mind, knowing that if your stock suddenly takes a dive you will not be turned into a homeless person. 
    • As an example, let's say you buy 100 shares of a stock at $10. Your total investment is $1,000 (plus commissions). If you enter a stop loss order for your 100 shares at $9.50 (a 5% loss), the order will stay active until the price reaches $9.50. At that time, an order to sell at whatever the current market price is (which should be close to $9.50) will be entered automatically, and your stock should sell almost instantly. By entering the stop loss, you have successfully capped your risk at $50 (5% of $1,000), even if you're not near your computer or paying any attention to the market when the price drops.
    • Managing your risk with stop losses is one of the most important parts of investing, even if you are not trading on a daily, weekly or even monthly basis. If you are an investor, you might only check your stock twice a month, so you really need to consider what will happen in the time you're not watching. Prices can and do fluctuate wildly and using stops will prevent you from losing more money than you can tolerate. 
    • One other thing: stick to your stops. If you cancel your stop because you are hoping the price will turn around, you are wrong. Cut your losses and move on. I know it sucks. We all hate losing money but trust me, you will hate yourself a lot more if you cancel your stop and then lose another 5% before finally selling out of frustration. Over time, you will find that it is much more profitable to just stick to your stops, cut your losses, learn and go make a good trade to make up for it.  
Size your positions accordingly:
    • A position is an investment. If you have $1,000 worth of a stock, you have a $1,000 position. With this in mind, another vital part of managing your risk effectively (and thus making money!) is to make sure your positions aren't too big. If you have a $10,000 portfolio and your risk tolerance is only 1.5%, you can only afford to lose $150 before you are outside of your risk tolerance. Now imagine that you've invested $7,500 into a single stock. You can only afford to lose 2% on the value of that stock from your buy price before you'll have to sell in order to stay within your risk tolerance. Now imagine that the stock only costs $1. On this particular stock, literally, losing two pennies ($0.02, two cents!) will cost you $150. Conversely gaining two pennies will earn you $150, but personally that is not the kind of risk I want to take. 
    • When making any investment, long-, mid- or short-term, you really want to be able to safely absorb about a 5% loss before you go outside your risk tolerance. This doesn't mean that you should always use a 5% stop loss, but as a worst case scenario, you should be able to if something goes wrong. 5% is also not some magic number, it's just something that I've found works well, and I think it works well because prices do fluctuate throughout the day and there are people out there who will manipulate the price just to trigger stop loss orders and pick up cheap shares. If you only have a two cent risk tolerance, you're very likely to get "stopped out" (have your stop loss order executed and the stock sold automatically).
    • To combat this issue, it's best to size your positions accordingly. Consider your total risk tolerance (in our extended example, $150). Now divide that number by the 5% you need to be willing to lose off the buy price of your stock (this will give you a maximum position size, in dollars: $3,000 for us). Once you have a max position size, you can simply divide by the price of one share to determine how many shares you can buy. Again, it is simple to create this type of calculation with a spreadsheet so you just have to pop in a couple numbers and you're ready to buy. You can even take it a step further and calculate the price you would need to set your stop loss at (95% of the current share price) and then look at the chart to determine if there is any significance to that number (e.g. is it right under support, does it look like the stock could hit it fairly easily, etc). Keep in mind that you don't always have to buy your max position size. Sometimes I only buy a quarter or a half of my max because I want to be able to allow the price to fluctuate more than 5% down while maintaining the same level of risk.
Calculate reward to risk ratios:
    •  A reward to risk ratio can tell you systematically how likely it is that your trade will succeed. Consider this: if you buy a stock at $6.25 and you've determined that there is support for the price at $6.00 and resistance against the price at $6.50, your potential reward is 25 cents while your risk is also 25 cents. This is a 1:1 ratio and is statistically nothing more than a coin flip. I don't know about you, but I don't want to be betting thousands of dollars on a coin flip. Instead, you must find investments and trades that provide you with a solid reward to risk ratio. The higher you can get this number, the better. Personally, I prefer to buy with a minimum 2:1 reward to risk ratio (i.e. risk 5 cents to make 10), but ideally I want to shoot way, way higher.
    • Another way to look at this is potential gain to potential loss. Ideally you want to have the potential to make at least twice as much as you could lose. If you are risking $150, you want to be able to make a minimum of $300 in order to make it worth it. Risking $150 to make $150 or less is not only stupid...over the long term it is financial suicide. Thus far, almost all of my very profitable trades have had r/r ratios above 5:1, and about 90% of my unprofitable trades have had r/r ratios below 2:1. To calculate the reward to risk ratio, simply divide the amount you could gain by the amount you could lose. Assume the same example as above, but this time there is support for the stock at $6.20. You buy at $6.25 and set your stop loss at $6.19, just under support. Now your reward to risk ratio is .25/.06 = 4.167 or about 4:1.This is a low risk trade that is likely to be profitable for you.
Manage your profit-taking:
    • This step is often the hardest. It's easy to sit back, throw your hands behind your head and watch your account value rise. What's not easy to do is find the top (or the bottom) of a price movement. It is impossible to know where the price will turn around and if you try to do it, you will ultimately end up losing money. Remember, you can always buy more if you sell too soon!
    • One technique that I personally love for managing profit-taking is called scaling. Under this strategy, once I know that a stock is comfortably on its way up, I will sell off about half of my position (usually at around a 5% gain) and raise my stop loss (cancel the original one and enter a new one) to the price I originally bought at. By doing this, I lock in a 5% profit and make the rest of the trade free. If a stock breaks through multiple resistance levels in a single run, I might even set my stop under the first resistance level (which is now support, remember?) above my buy price. This guarantees that even if I am wrong on the run and it immediately turns over and plummets, my stop will kick in above the price I bought at and I will still make money. Of course you will rack up more commissions this way, but remember that this guarantees that you will make a profit on the trade itself (as long as your position is sized correctly and you are properly managing your risk!) There is no question that once you sell half of your position and move the stop to the price you bought at that you have made a profit, and there's nothing anyone can do to make you lose money on that particular trade. Worst case scenario: the price falls back to your buy price and you stop flat with no gain, but no loss. I should mention that you do need to consider commissions here, but I can also tell you that if you are worried about your trade turning into a loss at the hand of a $7 commission, your position is not sized correctly or the trade is too risky and you need to re-evaluate.
    • Scaling is probably one of the most valuable and important things I've ever learned when it comes to buying and selling stocks, because it allows you to guarantee yourself a profit and at the same time allows you to completely forget about the trade and move on to making other successful trades if you want to (after all you've already made some money on it and the stock will automatically sell at or above your buy price if you stop watching it).
Remember, the real reason to employ all of the above techniques is that it will give you peace of mind and allow you to make intelligent decisions. The people who fail in this business are not stupid people, they are simply not managing their risk correctly. When you always know what the worst case scenario is and you have already prepared for it and decided that you are comfortable with it, you are less likely to make unfounded and rushed decisions which can cause you to lose money. I remember when I first started doing this I knew nothing about risk management. I would trade constantly, racking up huge commission costs and buying too high, selling too soon, chasing rallies in a stock only to see the price immediately plop back to earth. Then I would assume that it couldn't possibly fall any further and it must be ready to turn around at some point, so I would hold it...and hold it...and hold it...until finally I was so frustrated and had lost a ton of money that I sold out of pure anger. As a double-whammy, it always seems like half the time the price rises as soon as you sell for a loss and falls as soon as you buy into a rally. Trust me, I've been there, I've done it, it will make you insane. Don't do it. Manage your risk and you will be successful!

If you'd like to see and use a trade journal/risk calculator click here (File > Download as > Excel if you want to save it and learn how it works).

Monday, March 12, 2012

Taking the Plunge: Opening Your First Investment Account and Buying Your First Stock

Even in the short amount of time I've been doing this,  and probably because I am so vocal about it, one of the questions I am constantly asked is "so how do I actually start trading stocks?"

Of course this is a very generic question, but I understand why people ask it. I asked the same question when I first started. Let's be honest, it's a confusing world out there in investment-land. There are just so many different options and possibilities that many new investors quickly become discouraged and either decide to put off opening an account or just give up and go with something standard like an IRA or a Roth IRA. First let me emphasize that there is absolutely nothing wrong with that. Many people just want to focus on advancing their career and not worry about managing their investments. You know what though? I'll bet that a big reason for that sentiment is that many people over-complicate the process and become intimidated or discouraged because they feel like they just don't have the mindset to be able to handle it. That's you right? You're the overwhelmed, intimidated, frustrated and flustered (non)investor. Let me guess, you feel like you're going to open the wrong kind of account and be stuck with something you don't know how to use, right? You're afraid you're going to need EIGHTY-SEVEN BILLION DOLLARS by 9am tomorrow to put into your account and that the stock trading police are going to come after you if you don't buy and sell stocks every single day, buying into and selling out of mutual funds, ETFs, options, short sales, stocks, bonds, foreign currencies, and every other investment vehicle under the sun...right? Well, wrong. Don't over-complicate this. It's not hard.

First, let's talk about the different types of accounts you can open:
  • Individual Brokerage Account: 
    • For the majority of the people reading this blog, this is going to be your choice. An individual brokerage account gives you the ability to buy and sell stocks, mutual funds, exchange traded funds and options, as well as buy on margin (borrow stocks) and sell short if you want (assuming you fill out the right paperwork and get the right approvals). Think of this type of account as a checking account for stocks. My advice is to start here and expand as you learn more. This is the type of account that I use and it covers 99% of the things I do in the market on a daily basis.
  • Joint Brokerage Account: 
    • Same as an individual brokerage account, except it's managed by more than one person. Just like a joint checking account.
  • Individual Retirement Account (IRA):
    • An IRA is a long-term account. Any money you put into it can be deducted from your taxable income when you do your taxes (i.e. if you make $50,000 a year and put $4,000 of it into an IRA, you will only pay income tax on $46,000). This benefit comes at a cost though: you can't withdraw any of the money before you are 59.5 years old (with a few exceptions) unless you want to pay a 10% penalty, and when you withdraw it you will pay taxes on anything you earned.

  • Roth Individual Retirement Account (Roth IRA):
    • A Roth IRA is just like an IRA except for a couple key differences: when you put money into a Roth IRA you don't get the benefit of being able to deduct it from your taxable income. However, there are a couple benefits: First you can withdraw any money you've put in (principal) at any time, although you'll pay penalties if you withdraw anything you've earned. Second, when you reach age 59.5 you can withdraw all of the money TAX FREE. That means that with a Roth IRA as long as you wait until you are 59.5 to withdraw the money you've earned, you can do it without paying taxes on it.
    • In most situations, a Roth IRA is a better decision than a traditional IRA over the long term, however, neither a traditional or a Roth IRA is a good choice if all you want to do is buy/sell a few stocks. IRAs are called IRAs for a reason: they are retirement accounts. IRAs are designed to be funded gradually over time to earn slow, long term gains and build your retirement nest egg. They are not designed to make extra spending cash or build profits quickly...that's what an individual brokerage account is for.
  •  Corporate, Proprietorship, Trust Fund, other complicated accounts:
    • For beginner purposes, I'm not even going to get into these. I don't use them, don't know how to use them, and would be doing you a disservice if I tried to teach you how to use them yourself. Just know that they exist and that eventually they might be useful to you.
Ok, so now that you know the types of accounts that exist, you simply need to decide on which type you're going to use. Most of you are going to pick an individual brokerage account because you just want to dabble in buying and selling stocks, so that's the one I'll focus on. Now you need to pick a broker (like Scottrade, Ameritrade, eTrade, etc). A broker is just like a bank. They hold your money and when you want to buy or sell a stock you place an order with the broker (this will be done online for you 99.9% of the time. I have been trading actively for over 4 years and have never once placed an order on the phone).

When your broker receives your order, they work their magic and send your order to one of the stock exchanges like the NASDAQ or NYSE to be "filled." To simplify the process, the broker manages all the orders. The stock exchange handles matching the orders with each other. Let's say you want to buy 100 shares of company XYZ at $10 per share. You place the order with your broker, your broker sends the order to the stock exchange, and the stock exchange finds a seller who is willing to sell you 100 shares of company XYZ at a price of $10. Once that match is made, your order is filled and your broker charges you a small fee (a commission) for their trouble. Before you ask, no, you can't just contact the seller directly and place the order to avoid your broker's commission. If you want to do that you'll need to be a market maker and probably have an account balance in the hundred of millions of dollars.

So what sets one broker apart from another? Simply put: fees. Realize that every time you buy shares of stock you will be charged a commission. You will also be charged that commission when you sell the stock. Therefore the price of the commission should be your very first concern, since you will pay it every time you buy and sell stock. I know that right now eTrade charges $7.99-$9.99 per trade, Ameritrade charges $9.99 and Scottrade charges $7. There are cheaper brokers, but your best option is to pick a broker that is well-known because they will have the best customer service and offer the best help for new investors.

One other thing: don't be fooled by brokers that say "Open an account and get $500!" eTrade and Ameritrade both do this, and what it really means is $500 worth of free commission within the first 60 or 90 days. They will not give you $500 in cash, so really if you're just starting and you're only going to buy one or two stocks and then hold them for 3-6 months to learn how they work, this "benefit" is only worth about $15-20 to you (the cost of one or two buy/sell commissions). It's not a bad thing if brokers offer this, Scottrade might even do it now; all I'm saying is don't let that make your decision for you because it's not really $500 for a beginning trader/investor. Focus on the cost of commission, the minimum deposit amount and whether or not the broker charges maintenance fees or inactivity fees, as well as the layout and ease of use of their website, their customer service, etc.

Personally I started with Scottrade and would recommend them for beginners for a few reasons:
  • They have the cheapest commissions (and there are no decimal places which annoy me).
  • They have fantastic customer service and you can call their local offices or walk in any time to ask them questions or sit down with an adviser for free.
  • Their website is easy to use, clean and clutter free.
  • They have a very low minimum initial deposit (as little as $500 can open an account).
  • They don't charge maintenance fees or inactivity fees if you don't invest. There are no hidden fees that I know of and I have invested with Scottrade for 4 years.
  • Their investor education resources are great and they simplify many things that other brokers complicate (for example, they provide help for selecting an order type right on the order page). These are the types of things that are very useful for a beginning investor and encourage investment rather than complicating it and discouraging you.
Wow, Scottrade just got a free plug from me. Once you're ready to actually sign up for an account, and I'm sure this is similar with any other broker, here's what the process looks like:

1. Click "Open a New Account:"


 2. Fill out some basic info about yourself and select individual brokerage account:


3. Pick a branch near you in case you need to go there. This is also where they'll mail your check from when you make a bazillion dollars, so the closer the better!


4. Fill out your employment info and answer no to the three questions. The questions here are trying to make sure you're not a professional (which requires a different type of account):


5. Enter your DOB/SSN and verify your citizenship. Don't lie or the police will come and steal your last pair of clean socks:


6. Verify all the information you've entered and click "Accept and Continue:"


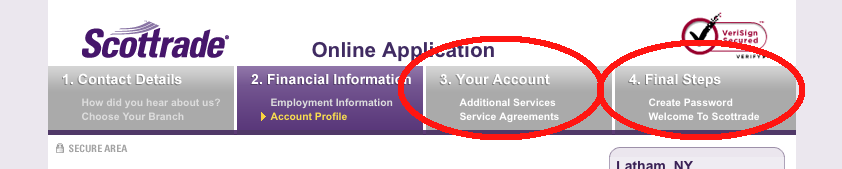
7. Answer a few more basic questions about any extra services you want (most likely none), read/sign any "agreements," create a password, and you're done!


That's it. It's really that easy. I would go through the rest of the process but unfortunately John Smith from Anytown, PA doesn't exist and I am down to my last pair of clean socks.

Finally, once you have the account opened, you'll receive a welcome package in the mail with a bunch of info to get you started, but you can also get started right away. Scottrade is fantastic with helping new investors and guiding you through your first steps, but to give you a general idea, once you have an account you'll need to fund it. This can be done with a check by mailing it or taking it to a local office, but I recommend simply linking your bank account to it. Just like if you wanted to set up automatic payments on a credit card, you'll need your routing number, bank account number, and information about yourself, and they'll likely need to do the whole "deposit two small amounts into your bank account to confirm it's yours" deal. Once you've done that you can transfer money into the brokerage account with an EFT (for free with Scottrade!) and it will be available to buy/sell stocks. I don't remember for sure, but I believe that there is a clearing period for your initial deposit so you might need to wait 2-3 days before you can actually use the money in your Scottrade account to buy stocks.

When you log into your account you'll see all the stuff you can do. For obvious reasons I've deleted my personal information, but this should give you an idea of what you'll see. On the home tab you can see your total account value, a chart of your performance, any open orders you have pending, orders that have executed, as well as any open positions (stocks you own) and a watch list (stocks you're watching). You can create watch lists or export data to Excel for your own use, and all of these areas can be customized to show whatever info you want as you start to learn more and learn what's important to you. Also on the home tab you can find links to fund your account, get tax info, etc:

 
On the "Trade" tab you can place orders by selecting an order type, how many shares you want, the stock symbol (aka ticker), and how long you want the order to remain active (you can select to have it end at the end of the day, "GTC" (good 'til cancelled), end in a few hours, or whatever you want). By the way, it should be noted that you are not charged a commission until your order is actually executed, so you can place an order and cancel it as many times as you want without being charged a dime. Note the links on the right that help you select an order type. This is why I love Scottrade for newbies!!!


So that's it! Hopefully after reading this you have a solid understanding of what it takes to open an investment account and buy your first shares of stock. My recommendation as far as what to buy is to invest initially in something you completely understand. Don't invest your whole account value. Leave yourself a little bit of leeway (even if it's only like $20) in case your order doesn't get filled at the price you expect (which does happen). Do NOT assume that you will make money on it. More than likely you will either lose money or you will stay flat. I always tell people who are just starting out to look at your first investment as the cost of learning how the market works, and to assume that you will lose it all (even though you probably won't). I will also say regarding your first purchase, however, to make it significant. Make it large enough that it would piss you off if you lost it, but small enough that it wouldn't break you either. You actually want to be a little emotional at first, so that you will look at your account and be like "WHAT THE HELL!!??!" when it drops and "WOOOHOOO!!!" when it rises. Without this initial spike of emotions you will never be motivated to learn what caused the fluctuation, which is absolutely the most important thing to understand. If you get emotional on your first trade, it will motivate you to learn, and the motivation to learn is what will get you hooked. I recommend a first investment of $500-$1000 in one or two companies at most.

The first shares of stock I ever bought were shares of a company I worked for at the time. I knew everything about the company and how they operated. I knew what the company did, I knew people who worked there and understood the management style. I also had a general idea of how well the company was doing. Following this strategy for your first investment will be immensely valuable because you can buy the stock, watch it, and see how it acts. Plan to hold your first investment for at least a couple months, hopefully longer, in order to get a true understanding of how it fluctuates and moves.

Observe as you hold the stock how it reacts to changes in the market. Watch what happens when there is something in the news about the company or what happens when they release their earnings report (this happens every three months). Study the chart and try to pick up patterns by looking back a few years. On many stocks you can even pick out patterns in charts that show price in one-minute intervals! The most important thing to remember is don't get discouraged. Don't let your emotions take over and sell the stock just because it drops a few pennies! It will fluctuate and your account value will drop, maybe significantly. If it does, try to understand why, but keep in the back of your mind that the likelihood of you actually losing your entire investment, while possible, is very slim. It takes a lot to make a stock drop to zero, usually something huge like the company filing for bankruptcy protection or one of the insiders getting caught embezzling money or something. The point is: buy the stock because you understand it and with the intention of using it to learn the market. Don't necessarily worry about making money for your first trade. As you watch the stock and its behavior over a period of a few months, you will start to see patterns and you'll begin to see what the market perceives as "fair value" for the stock. From there you can start to see how to make money by buying it below what you think fair value is, and selling it above fair value.

Of course there's a LOT more to analyzing stocks, but that's what the rest of this blog is for. The point of this post is just to get your feet wet and get you invested. Trust me, the first time you throw $500 or $1000 of your hard earned money at a stock you will become married to it. Every tick, every penny, every day you will want to know why it changed because you will be making and losing money without actually doing anything. It was these changes that got me hooked on investing, and I bet it will get you hooked too!

Tuesday, March 6, 2012

Analysis of the Beast - Support and Resistance

Hi inter-friends!

Have you ever looked at a stock chart and wondered how the heck all of that stuff makes any sense at all? I had, and I spent a long time trying to figure it out. I finally did, and now I'm going to let you in on a little secret. There is one (yes, one) fundamental concept you need to understand about charts in order to utilize them effectively in trading and investing, and that is the concept of support and resistance.

If you never learn anything else about reading charts, learn the concept of support and resistance. Of course, if you want to actually make money in the stock market you're going to need to learn a lot more, but understanding this concept will make everything else much easier. Everything comes back to support and resistance.

Do you remember in middle-school economics or social studies when your teacher taught you about supply and demand? What happens when there is a large supply of a product but not much demand for it? That's right, the price falls. Likewise, as supply decreases or as the demand for the same supply increases, the price will rise. This is why diamonds are expensive. Diamonds are rare, but there is a lot of demand for them because they are beautiful, hence they are expensive. The reason I bring this up is that the same is true for stocks and other investment vehicles. When there is a large supply of shares (a lot of people who want to sell it) and not much demand, prices must fall in order to convince buyers to buy. Likewise when there are a lot of people who want to buy and not many people who want to sell, shares of the stock are hard to come by, so sellers get to name their price, driving the price back up. This is where the concept of support and resistance plays a role. Before we get into this too deeply though, let's define support and resistance:

  • Support: A price level which the stock has historically had difficulty falling below.
    • The reason support exists is that (in theory, at least), as the price of the stock falls, more and more buyers will want to own it (because it's cheap, a good value, see? This isn't hard!) At some point, as the price moves down, buyers will outnumber the sellers in the market, and the price will start to rise again because of the influx of buying activity (lots of demand = high prices!)
  • Resistance: A price level which the stock has historically had difficulty rising above.
    • The reason resistance exists is the exact opposite of the reason that support exists. At some point as prices rise, buyers simply will not be willing to pay more for the stock, and thus sellers must lower their prices in order to be able to sell the stock (lots of supply = low prices!)
Now, are you ready for me to completely contradict myself? Here goes: the reason that support and resistance are so important is that someone will always crack. At some point, a buyer somewhere in the world will give in and say "Ok, fine. I'll give you one more penny for it." The same is true in the opposite direction, meaning that at some point if a seller wants to sell his or her shares badly enough, they will always give in and agree to take slightly less than they wanted to. Emotion drives the market and people want to buy and sell. Eventually, they will give in. These levels at which there is a battle between buyers and sellers over whether the price should be higher or lower are known as support and resistance.

If you're still following me, there's a good chance that at this point you're wondering why this makes any difference at all and why I'm rambling about it. Well check this: when that person finally cracks, whether it's a buyer or a seller, it starts an emotional chain reaction that echoes throughout the market. Think of it this way. If the price of a loaf of bread were rising at a dollar per hour and you needed bread, would you wait to get it? If you would you're either stupid or you're already rich (but still stupid). Of course you wouldn't wait! You'd grab your shoes and be out the door after your loaf of bread so you could get it at the cheapest price. The same thing happens in the stock market when the price rises above a resistance level: all those buyers who were dragging their feet suddenly go "oh crap! I need to get this now no matter what price it is because it's only going to get more expensive!" The result is a huge influx of buyers which drives the price up until all the buyers who wanted shares have bought, and the ones who weren't quick enough have given up and think it's too expensive (keep those guys in mind). That's where you run into the next level of resistance.

As you would expect, the same is true in the opposite direction. The emotional chain reaction goes backwards, with sellers quickly dumping their shares when they see a key level of support fall apart because they want to get as much money as they can for their shares, and they know that prices are only going to fall further. The influx of sellers drives prices down to the next level of support, where there are no more sellers willing to sell, and the buyers who missed the boat last time (remember those guys I told you to keep in mind?) come in to prop the price back up (support!) Finally, if the buyers get control again, the sellers who didn't sell fast enough last time will provide the resistance that buyers need to break through. This cat and mouse game can only go on for so long before the number of people who want to buy or sell has completely dwindled to nothing unless the price changes significantly. When price finally changes, that's when you get a KABOOM!

When you read about support and resistance on other blogs and investing websites, what you'll often find are pictures of charts illustrating support or resistance but no explanation of why it is significant or meaningful. To illustrate how you can use this concept to make money in the market, which is after all the reason we do this, I'm going to show you the chart for a trade my team took today and explain key support and resistance levels (I've drawn them in blue) and how we used them to determine the perfect times to buy and sell, all day long (I recommend opening this chart in a new window so you can follow along):

Click to Enlarge

Before we get started, each of these "candles" represents five minutes, since this is a five minute chart, and shows you the price range the stock traded in during that period. You can follow the timeline along the bottom and the prices along the right. Each bar in the graph at the bottom shows you the volume or the number of shares that changed hands during that five minute period of time. Candlesticks, volume, and all the other lines/numbers on this chart are something that we'll get into in more detail in another post, but for now, just know that they exist and try to understand the basics of what they represent.

Around 8:30am we got word in our chat room that this company (a medical company called Vermillion) had just issued a press release: something about one of their drugs passing a significant milestone and getting some kind of approval. What the release was about didn't matter, the point was that the market saw it as a good thing and for some reason seemed to think it made the stock worth a lot more. Lots of buyers rushed in to snatch up shares and even before 9am we can see that the chart is significantly higher than the day before. As soon as we opened this chart we knew it was going to be huge. You can see that immediately the price hits a wall around $1.80 and then pulls back. Thus we assume that if it picks up again, $1.80 will be a level of resistance and if it breaks through that level, it means it should run to the next level of resistance. We can also see that after hitting a wall at $1.80, the stock fell back to about $1.49 before turning around. Keep in mind this is all before 9am when the market is not even open yet, so we're not giving this too much notice, other than that we're now very interested in that $1.80 mark.

Some of our guys put in orders to buy this stock at $1.81, $1.82, $1.85, and $1.89. Interestingly, if you look at the volume graph, you can see that in that first 5 minute candle after the market opened at 9:30am over 104,000 shares changed hands (either being bought or sold). If you consider the fact that this particular stock typically has a daily volume of around 80,000 shares, you know something big is going on. This stock blew it's normal daily volume out the window in the first five minutes of trading!

Anyway, right at 9:30 we see the large volume spike and almost immediately afterwards another huge spike and the break above $1.80. All the buy orders triggered at that point, and some of our group became proud owners of this sexy new stock. Generally when this happens, we will all immediately place orders to sell the stock if and only if it drops back below the previous level of support because that would mean there weren't enough buyers to keep the price rising. In this case, many people placed their orders to sell much higher (like around $1.75 or $1.70) to minimize their potential loss. So now we wait. The people who bought hold the stock and see what happens. We are carefully watching that $1.80 mark to see if it drops back below, and if it does, we decide whether we want to sell or let the buyers try to take control again and risk losing money. It's common for prices to "retest" these levels once or twice, so it's not wise to jump ship immediately if the support doesn't hold, but that's why we have the other levels of support: to determine a good time to finally let go.

As you can see on the chart, the price rises quickly on huge volume from 9:35 to 9:45, from $1.80 to $2.05, and then starts to fall. We now know that the breakout was successful, it's hit a level of resistance, and that $1.80 is our new support. Now we don't care about $1.49 anymore, we only care about $1.80. If the price drops below that even by a couple pennies, the trade is over. Most people in our group who bought at $1.80 sold everything they had at $2.00 or so because they realized that the volume was starting to shrink. This is an unheard-of gain for basically a ten minute time frame: 11.11%. (on a $2500 investment that's over $275 in ten minutes...I'd say most people would be happy with that!)

Of course there are always the risk takers. In our group that's basically everyone, and they are all master risk managers who pride themselves on minimizing their losses and maximizing their gains. Those people saw the volume spike up again around 11:00 and decided they'd better start watching to see if the stock breaks through the $2.05 mark (the last known level of resistance...are you seeing how this works yet?!) Sure enough, at 11:06am we see another big volume spike, and in the next five minutes the price breaks through $2.05 for another ridiculous gain. Most people here put their buy orders in around $1.90 and sold around $2.15 10-15 minutes later. Some held longer and rode the price up to $2.25 before selling (another 18.4% gain in 15 minutes, or $460 on a $2500 investment). The team continued to do this all day, with people buying and selling at various price points throughout the day based almost entirely on closely monitoring support, resistance, and volume. Some people made literally thousands on this stock today!

Listen, don't get me wrong: these types of plays are rare. It's far from common to see a stock rise over 125% in one day and trade literally 125x its normal daily volume. However, this is a fantastic example of how support and resistance can be used to find the right time to buy a stock, whether you're looking at a chart showing you 5-minute candles like this one, or a chart showing you weekly candles that dates back 5 or 10 years. If you're a long term investor, you might notice that a stock's price always seems to fall back down once it hits a certain level if you look at a chart showing the entire lifetime of the stock. Take a look at Microsoft, and you can see that around $32 has been a resistance point since 2008. The stock is now nearing that level of resistance. Does that signify the start of a new long-term uptrend? Well, let's be realistic, it's Microsoft...their stock has been flatlining since 2000, but you get the idea. Another awesome example is KERX, which we traded recently. This one broke through three levels of resistance in one day because of a good news story about their company: one at $3.70, one at $4, and one at $5. Anyone who entered at the $3.70 or $4 level would have made between 25% and 35% on this trade ($625-875 on a $2500 investment). 

Click to Enlarge
Whatever your investment style, please master support and resistance. You will be glad you did. Watch some stocks as they break key levels and watch what happens to the prices above and below those levels. Where are the next levels of resistance? Where is the support that would make you realize something bad was imminent if the stock broke below it? If a stock has bounced off a specific price four times and is now near that price for the 5th time, will you be watching closely to see if it bounces again or breaks through? If you master this one simple technique, your ability to accurately predict price movements and determine the best time to buy and sell will greatly improve.

That's all for now ladies and gents, check back soon for more ramblings!

Sunday, March 4, 2012

Choosing an Investment Style

Hi everyone! I wanted to do a post for people who are very new to investing in the stock market and might not know where to begin. This post assumes that you've already set up a brokerage account, put some money into it, and you're ready to invest. If you haven't done that, start here.

Once you are ready to invest, you need to decide which style of investing you're going to focus on. Here are some questions you should ask yourself:

  • Do I want to be an investor or a trader?
    • Investors invest. Traders trade.
    • If you plan on buying stock in companies that you believe are undervalued and holding it for 5, 10, 15 or more years, looking for steady gains over the long term, you're an investor. Warren Buffett is an investor. He uses a "buy and hold" strategy that involves analyzing a company's financial situation, their management, macroeconomic factors that affect their market, their products, etc., and seeking out companies with a stock price that doesn't make sense given how profitable the company is.
    • If you plan on buying and selling stock quickly, holding your stocks for only a few months, a few days, or even a few hours or minutes, you're a trader. This is by far the most profitable investment strategy in the short term, but it's also the most risky. I don't personally recommend it for beginners, because without understanding how the market works at a fundamental level you will never be a successful trader. Most people that do understand how the market works are still not successful traders because their emotions get in the way. 
    • You can mix and match. Personally, I use both of these strategies. Primarily, I am a high-frequency trader, but I have another portfolio which contains stock in companies that I believe are undervalued or show promising potential for long term gain.
  • How attached am I to my money?
    • Remember that with any style of investing, it is possible to lose your entire investment. Even the most careful investors and the most aggressive traders will suffer losses from time to time. They key is to manage your risk. A good test to see if you've got the chops to be an investor is to take ask yourself if you would be able to handle seeing your checking account's value drop significantly for no explicable reason in a matter of days. If you could handle that, you can be an investor. If you want to know if you could be a trader, ask yourself if you'd be willing to throw $500 in the toilet and flush it. If not, trading is not for you. If you can't handle either of these things, you're better off getting yourself a financial planner or a professional money manager and planning on working until you're actually the legal retirement age. Sorry, but that's the way it is. You've got to have brass balls in this game, and you have to pay to play. At the same time, the most profitable investors are almost always those who hate losing money because they are great risk managers.
  •  Am I more interested in business or numbers?
    • If you're a business person and you think you'll enjoy owning part of a company that you completely understand, you're going to want to stick to fundamental analysis. This means that in order to decide whether to buy a stock or not, you'll focus on the company itself. You'll want to understand how much debt it has, how much money it makes, who its customers are, what products it makes or what services it provides, whether or not you think the products or services are useful, its relationships with its competitors and partners, and more. Your goal as a fundamental analyst is to become one with the stock. Warren Buffet is a fundamental analyst. He once stated that the reason he has been so successful in his investment endeavors is that he never invests in something he doesn't understand. If you follow his strategy, maybe you'll end up like him someday (ahem, he's a multi-billionaire by the way). 
    • If you're a numbers person, you'll love technical analysis. While this strategy is generally used more often by traders than investors, many investors couple technical analysis with fundamental analysis to find the perfect buy price for a stock, and the perfect sell price. Technical analysts are the people who can look at a chart like the one below and tell you what everything means, and why it's there, and what's likely to happen to the stock in the future, without knowing anything at all about what the company does. In my opinion, technical analysis is much more exciting because it's very fast paced, high-pressure, and full of fascinating phenomena.
    • Again, you can combine these strategies. I do. For long-term investments, I carefully analyze all the aspects of the company itself, and after I've purchased the stock I use technical analysis to watch for warning signs that it might be time to sell part of the position or buy more at a better price. There are also times when I will look for a specific chart pattern for a short term trade, and combine it with something like an earnings release date. Those kinds of alignments can be hugely profitable. I have seen people buy a stock based on a chart pattern and double their money in less than an hour because the company released better-than-expected earnings on the same day.
[Click to Enlarge]

  • What are my goals?
    • Know your goals. If your goal is to be financially independent, this is a great way to  reach your goal. If your goal is to take a ton of risk and become a gazillionaire by next Tuesday, go to the casino. No matter what you do, investing is not something to be taken lightly. It's easy, sure, but it requires dedication and a thorough understanding of what you're doing. After all, this is real money you're playing with. If you lose it, there is no reset button. There is no edit > undo. Know your goals and focus on them. If you need help deciding what your goals are, just ask yourself "Why do I want to invest?" The answer to that question will be your goal and will tell you whether or not it's right for you. 
Knowing which kind of investment strategy you prefer (investor vs. trader, fundamental vs. technical analysis), your risk tolerance, and your investment goals are three major decisions you need to make as you get started. Note that I did not say you need to make these decisions before you get started. I didn't know what my goals were when I first started. I just knew that I wanted to know what investing was all about, and how I could learn to control my own future and not have to depend on someone else writing me a paycheck for the rest of my life. I also transformed from a fundamental analyst to a technical analyst over time. You don't need to know all this stuff right now. You only need to think about it and be interested and dedicated enough to discover the answers as you move forward. As you advance, you will likely agree this is really a fascinating and completely new world within the one you're used to.

Why I'm Not Worried About the Current State of the Market (from 8/9/11)

Here is a note I wrote on August 9th, 2011 after the markets took a dive when the credit rating of the US was downgraded. I'm just posting it here to get my old ramblings on the site before I start publishing new posts:

---


Hi guys and girls. First of all, let's be honest: we had this coming to us. Since the debt ceiling was implemented in 1917, it has been raised over 100 (yes, 100) times. 100 times. These times weren't all bad. Most of them were for good reason...our GDP was growing, hence it made sense to increase the amount of money we could borrow so that we could continue to grow our economy. Problems arose when our GDP began growing at a lesser rate than our national debt (and really our debt ceiling, since the standard procedure was simply to raise it when we came too close). Over time, our debt got a little bit closer to our GDP, until recently when someone finally looked back at the chart and said "Son of a ... ! We are only bringing in $5 a week and we're spending $6 a week and paying interest on that extra dollar! Quick! Raise taxes!"

Here's a good video that explains it in simple terms: http://dailybail.com/home/bankrupting-america-history-of-the-us-debt-ceiling.html

Blah blah blah, right? I know, you've all heard this 100 times. Here's why it matters: The majority of the people on this planet (in this country in particular) DON'T UNDERSTAND THIS CONCEPT. Because of this, they buy into what the media tells them and believe that the economy is going to tank. To protect themselves, they decide to liquidate stocks and non-cash securities because they believe that in a market where nothing is certain, cash is king. In a strange type of self-fulfilling prophecy, the media's obsession with the economy collapsing and their continued reporting of such actually DOES bring on a collapse in the stock market like we've seen over the last few days. Specifically today, the Dow Jones Industrial Average dropped over 634 points or 5.5% to close below 11,000 for the first time since November of 2009.

But, really, what's changed? Sure, Standard and Poor's downgraded the US credit rating...from AAA to AA+. This is the equivalent of your FICO score dropping from 850 to 825. Of course it's lower, but it's still a fantastic score and really, not a thing has changed because there are still people out there who have 500s and 600s and they're the only ones the bank REALLY doesn't want to lend money to. Fundamentally, nothing about the companies in the DJIA has changed a single bit. In fact, that's true about most of the broader markets. This, ladies and gentlemen, is called PANIC SELLING. It's something I've seen plenty of times and it is usually a fantastic opportunity to make money.

Let's use logic here, people: When the economy takes a dive into the sewage system, what's going to happen to peoples' spending habits? Well, until recently, they wouldn't have changed at all...that's why we're in this mess to begin with. Now, since the markets are falling like Granny on an icy doorstep, people who are sticking it out are poised to lose a lot of money. Those people will change their spending habits. They will buy fewer luxuries and an equal amount of or more necessities. Things like paper towels, toilet paper, underwear, toothpaste, food, beverages, utilities, gas - these are the things that people cannot avoid spending money on. The rest of the people will take their cash and either a) save it, which we don't care about for the purposes of the stock market, or b) spend it on things they don't need which are made by the rest of the companies in the stock market.

My point is that the market is not going anywhere. Companies are still making money, they still make great products, they still have strong management. Just because the credit rating of the US took a well-deserved hit doesn't mean it has to end in disaster. If people really want to use their money to their advantage, they should be investing it in CASH RICH companies that make CONSUMER STAPLES. Why? Well, because when the US can't pay its debt, debt becomes more expensive, and companies with a lot of cash can afford to grow their businesses without taking on additional debt. Secondly, consumer staples are just that - staples - and we NEED them to survive.

Personally, I'm not worried about this situation. Don't get me wrong...I've lost close to 15% of my portfolio in the last three weeks. But the panic selling is creating a lot of great bargains. After the market stabilizes over the next few days (obviously at much lower levels), those interested in getting involved in the market might do well to pick up some shares of some of the biggest, cash-heavy, proven companies out there that provide things that we need in order to survive (or at least lead reasonably comfortable lives): companies like WalMart, Home Depot, Lowes, Coca Cola, National Grid, light bulb manufacturers, utility/electricity companies, retail clothing chains, etc. In addition, now is a great time to look at startup and innovative (e.g. green energy) companies who have been hammered over the last few weeks but that have a solid business model, consistent earnings, and have released no bad news. Those types of companies are very likely to be undervalued in this type of market.

When all is said and done, take a look at the max term chart for the DJIA:

http://finance.yahoo.com/q/bc?s=^DJI&t=my&l=on&z=l&q=l&c=

This is but a small dip in the grand scheme of things. The likelihood of a crash to the bottom is very, very low, and most people would do much better to take advantage of all the cheap prices. Until the companies in my portfolio start releasing news stating that they're hemorrhaging money or growing less or spending more or losing efficiency, I maintain that they still have the same or better intrinsic value as the day I bought them, and the overall values have only increased due to the heavy reduction in prices.

"Today people who hold cash equivalents feel comfortable. They shouldn't. They have opted for a terrible long-term asset, one that pays virtually nothing and is certain to depreciate in value." - Warren Buffett